|
Security Metrics Reports |

|

|
|
|
Security Metrics Reports |
|
|
Security Metrics Reports
|
Security Metrics Reports |
|
|
|
|
Security Metrics Reports |
|
|
A special kind of security holdings report, called the Security Metrics report, is available to provide a combination of fundamental and graphical technical information about common stock securities held in the portfolio being reported, as shown in the following example.
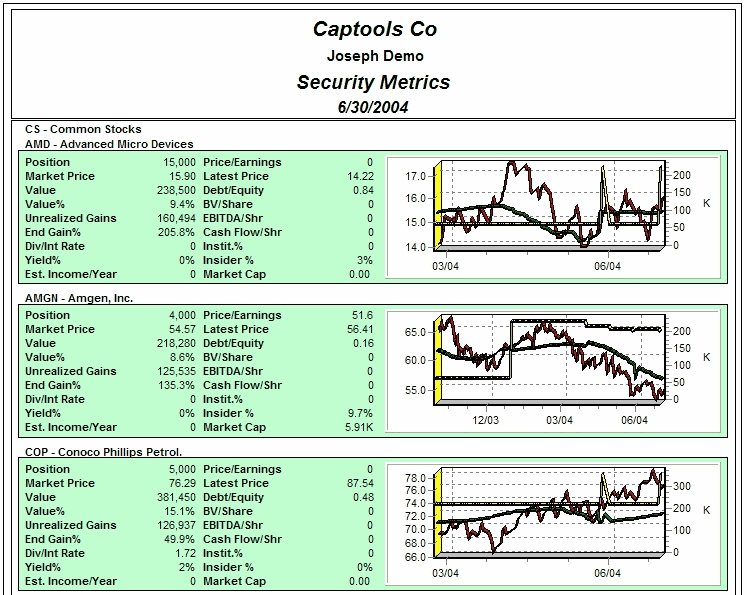
This report relies on complete and current price history data on the relevant securities as well as current and complete security statistics records on the relevant securities. Both of these types of records are normally updated via manual or scheduled data downloads. However, these downloads may not be available to you on all of your securities, and/or all of the data elements may not be available from your download data source (see the topic Data Downloads for more information on Captools/net downloads). If the necessary information is not available on all of your securities, the ones for which data is not available can be excluded from the report using the Exclude Security Types report special option. If certain data elements are not available, you can edit the report to exclude those data fields dependent upon those data elements.
Security Metrics Chart - The security metrics chart component graphically displays the price history for the security for the plot range specified in the report special options or the period that the security has been held in the reporting period. The graph also displays the price 90-day moving average and the cost or value of the security portfolio holdings during the chart time period, adjusted at the frequency at which the portfolio is valued.