|
Performance Benchmark Indices |

|

|
|
|
Performance Benchmark Indices |
|
|
Performance Benchmark Indices
|
Performance Benchmark Indices |
|
|
|
|
Performance Benchmark Indices |
|
|
Captools/net portfolio performance reports allow you to compare performance versus user selectable benchmark indices. You can specify a primary benchmark and up to eight secondary benchmark indices per account. Depending upon your program level, these indices may be specified as "synthetic" indices which are constructed from securities or other indices as described in the topic Benchmark Indices in the chapter on Securities. Higher level Pro and Enterprise users can also compare performance versus an account-specific synthetic blended index, versus a holdings-weighted security benchmark, and/or versus a model portfolio benchmark constructed from the model portfolio assigned to the account. These operate as follows:
Market Indices
The account records permit you to specify up to nine indices for the account which will be used in reports for that account, and for any subsidiary accounts if a report contains data from multiple accounts:
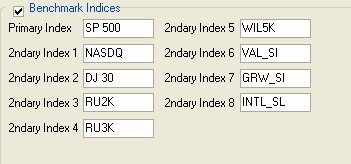
The indices specified can be market indices, of the type widely reported (e.g. S&P 500), or can be synthetic indices, such as the last three indices in the example above. Synthetic indices can be constructed as described in the Securities chapter in the topic Benchmark Indices. Synthetic indices can be static, meaning its composition is not assumed to change over the reporting period, or in higher level program versions it can be dynamic meaning that the composition can be defined to change over the reporting period.
Account-Specific Blended Index
Portfolio Performance type reports also give you the option to include a synthetic Blended Index ROI (labeled as such in the report body edit control). The Blended Index is specified using a special type of account note record as described in the topic Blended Index. Unlike a synthetic index defined in the security record, this benchmark is specifically tied to a particular account. This index can be static, meaning its composition is not assumed to change over the reporting period, or in higher level program versions it can be dynamic meaning that the composition can be defined to change over the reporting period.
Holdings Weighted Security Benchmark
Both Security and Portfolio performance reports can report an Average Security Benchmark ROI (labeled as such in the report body edit control). Each security in the Security Id record contains a Benchmark Index field that allows you to assign a benchmark to each security:
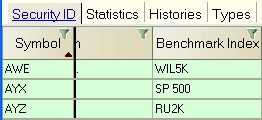
The Average Security Benchmark ROI is computed as the asset weighted average of benchmarks assigned to each security held within the portfolio. Any positive or negative deviation of portfolio performance from this benchmark can generally be attributed the portfolio being composed of securities which under or over-performed their benchmark on average.
Model Portfolio (Investment Policy) Benchmark
Higher levels of the Pro and Enterprise versions support reporting of a performance benchmark derived from the Investment Style assigned to an account. These benchmarks are labeled Static Model ROI and Dynamic Model ROI in the report body edit control. These benchmarks are computed using the investment model defined for the investment style in the Captools/net allocation records, with the Static Model ROI computed based upon the model in effect at the report's end date, while that Dynamic Model ROI takes into account the changes in the model over the reporting period. See Model Portfolio Benchmarks for more details.
Benchmark Index ROI Computation
Benchmark ROI's are computed using index values retrieved from Captools/net price history files, including any distributions specified in the distribution history records. Synthetic indices are computed by combining the performance results of the components you specify in the synthetic index note records, using the weightings you specify. Thus, for each index you wish to use as a benchmark, you must make an entry in the security list and regularly collect pricing and distribution data with a frequency at least as often as you create and price portfolio valuations.
Index Dividends - One problem with comparing portfolio performance with popular market indices is that these indices often do not include dividends. One solution to this is to observe the dividend rate of a fund which tracks your particular index, and to enter that rate in the Captools distribution records for that index. Thus, if you are using the S&P 500 as an index and you see that the Vanguard 500 index fund dividend rate (not capital gains distribution rate) is 1.8%, then you can enter a dividend of 1.8% divided by 12 in the S&P 500 distribution records every month. A more rigorous solution to obtaining an accurate benchmark is to obtain and enter dividend adjusted figures for applicable indices in lieu of the actual index value. Such figures are published by some of the major brokerage firms and financial publishers.